|
|
Daily Updated COVID-19 Plots
COVID-19 Plots
 |  |
 |  |
 |  |
 |  |
 |  |
 |  |
 |  |
 |  |
 |  |
 |  |
 |  |
 |  |
 |  |
 |  |
 |  |
 |  |
Methology
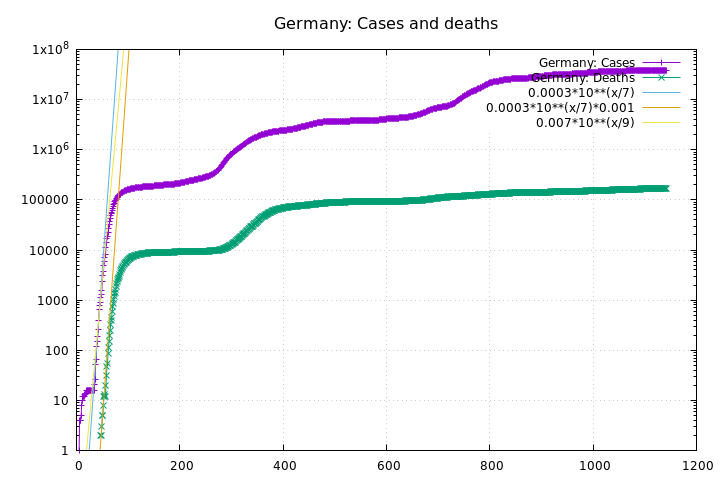
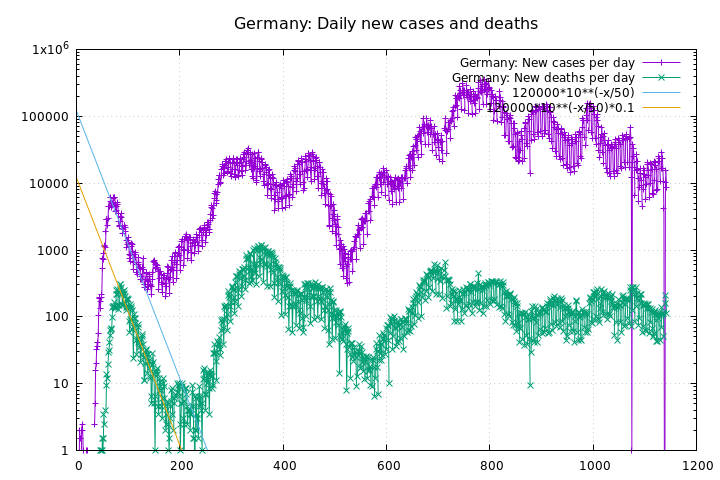
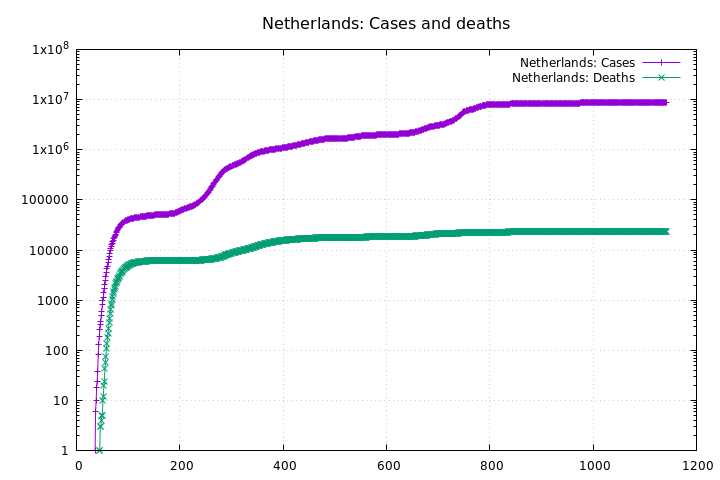
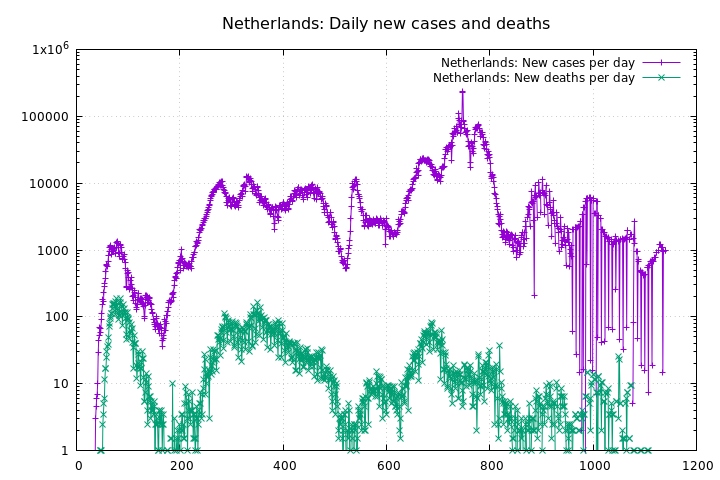
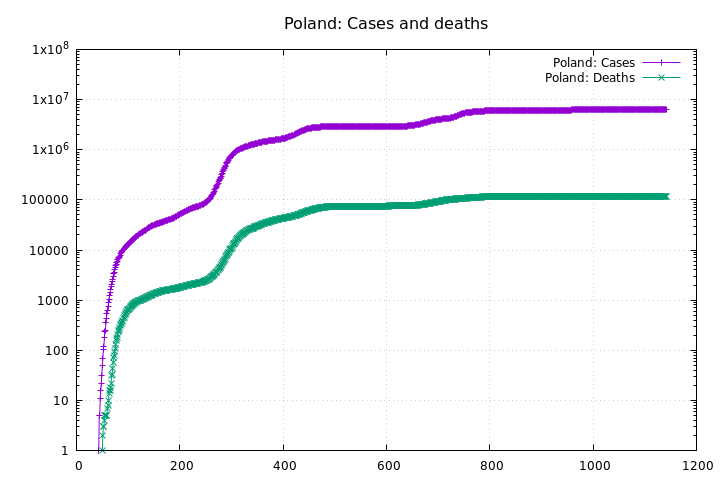
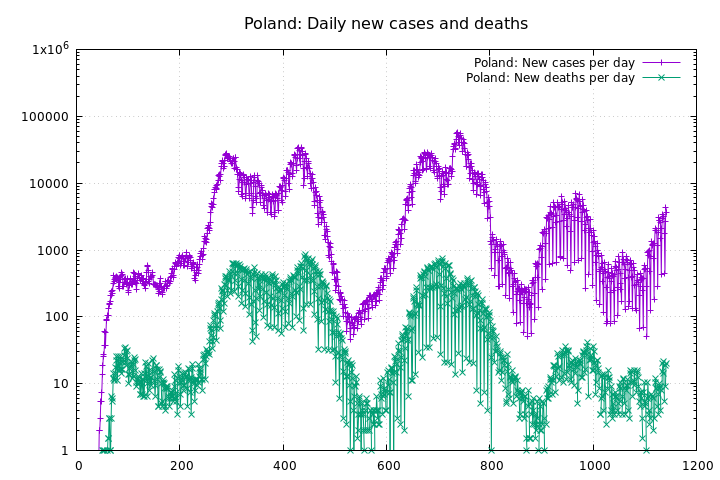
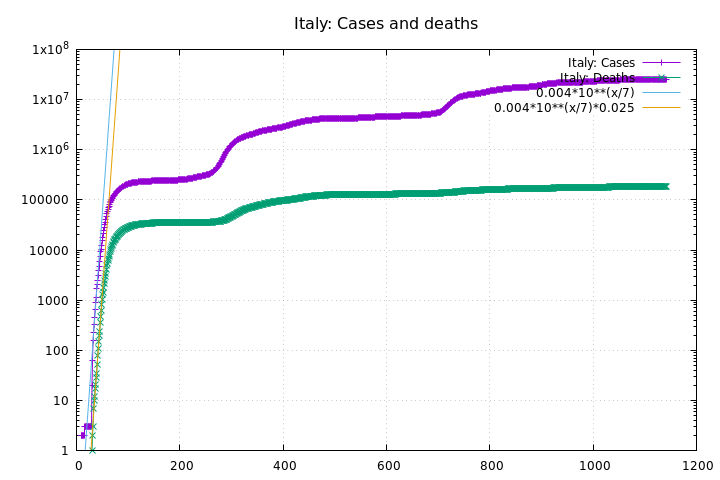
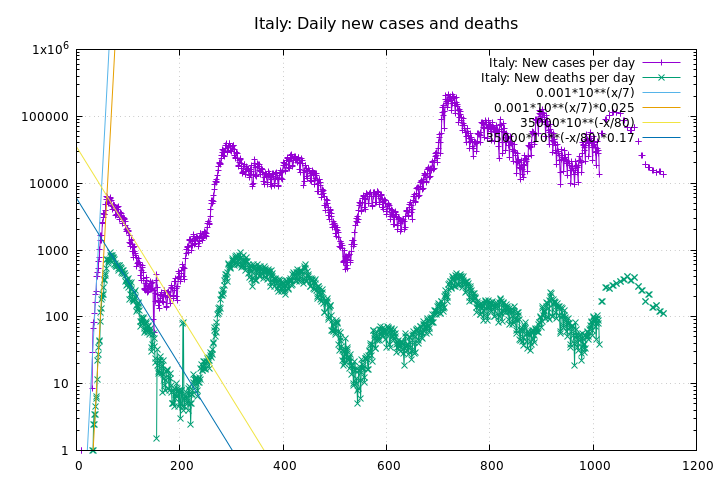
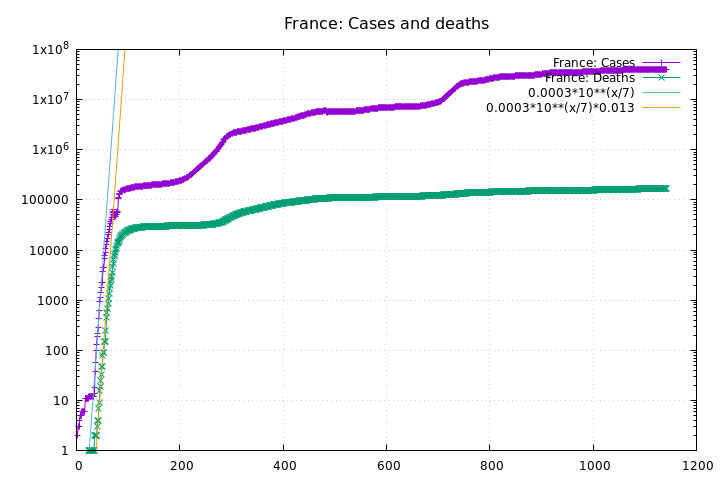
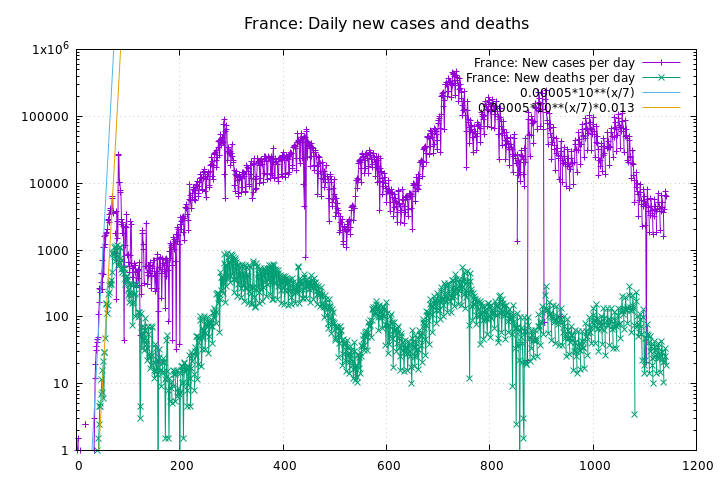
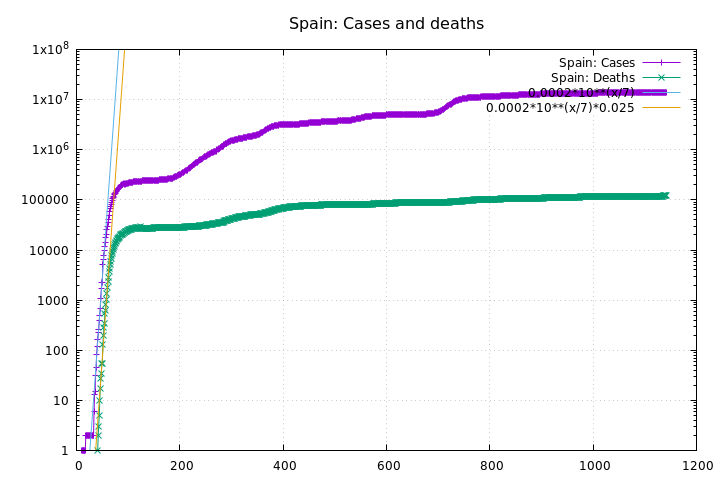
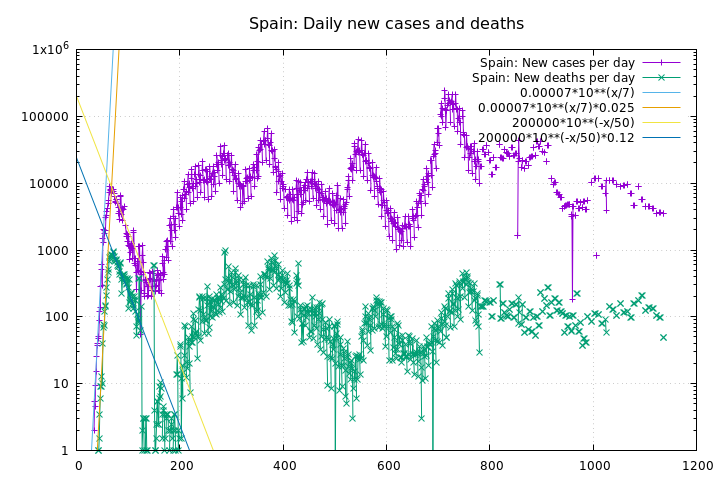
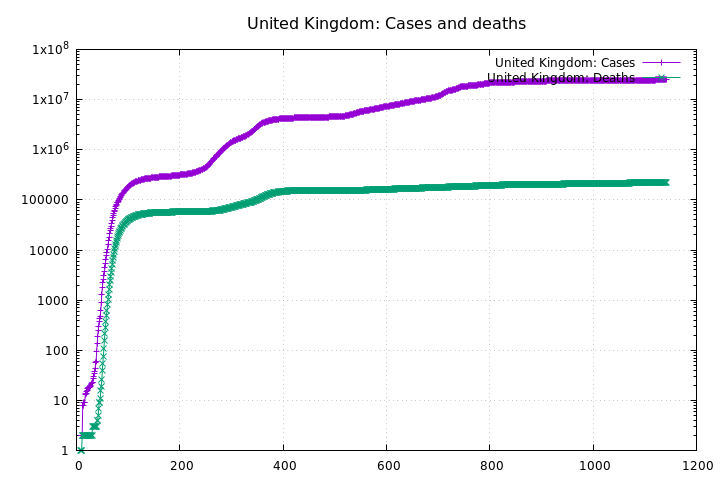
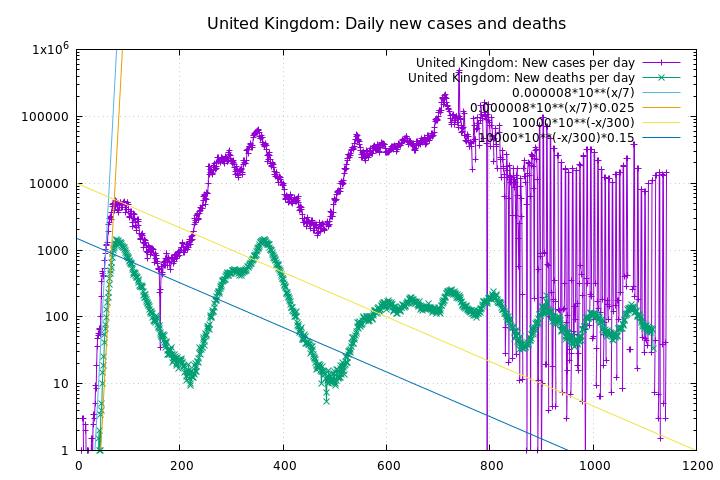
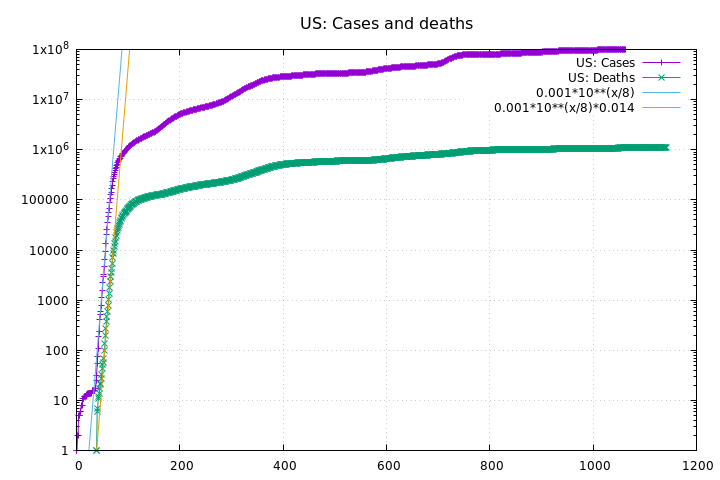
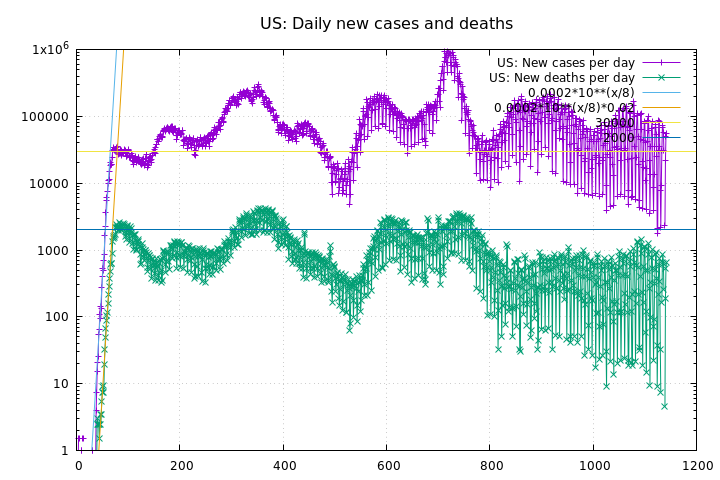
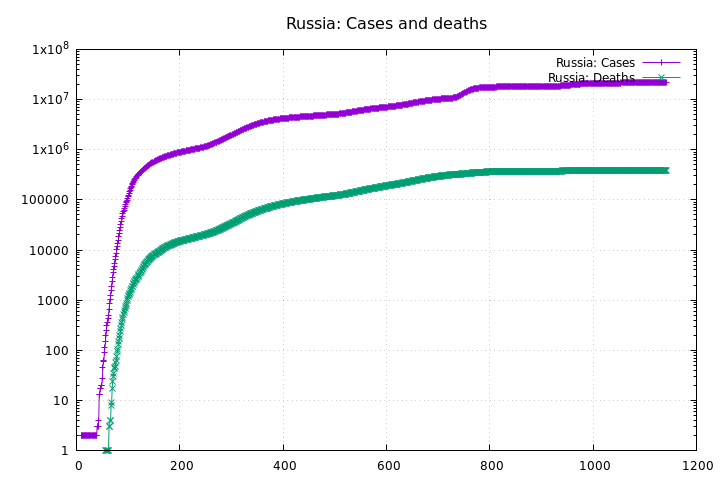
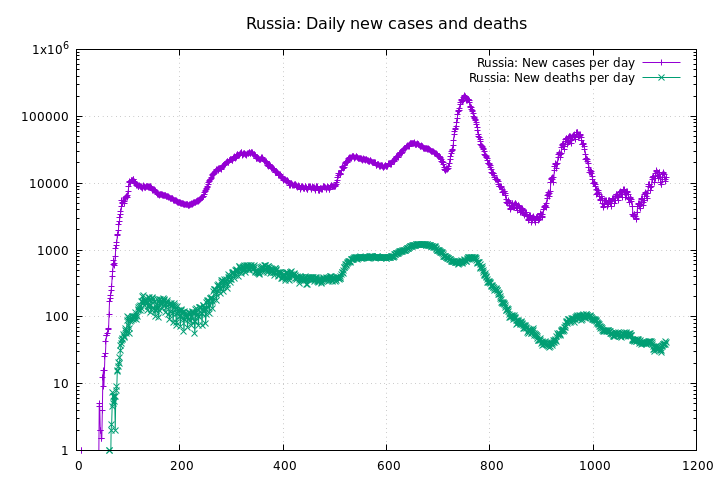
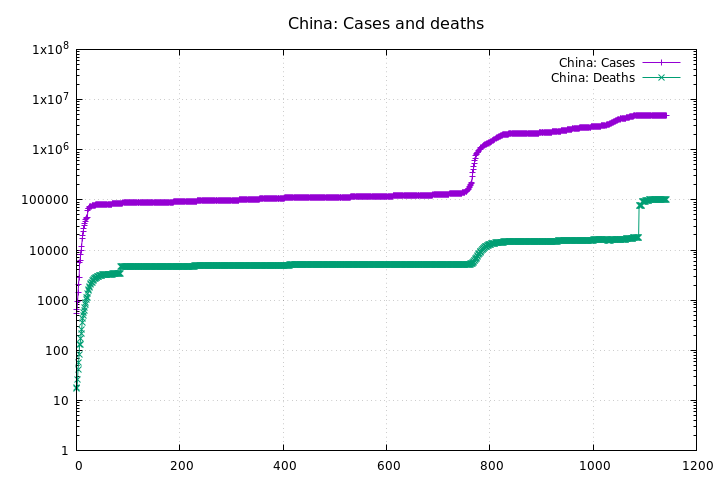
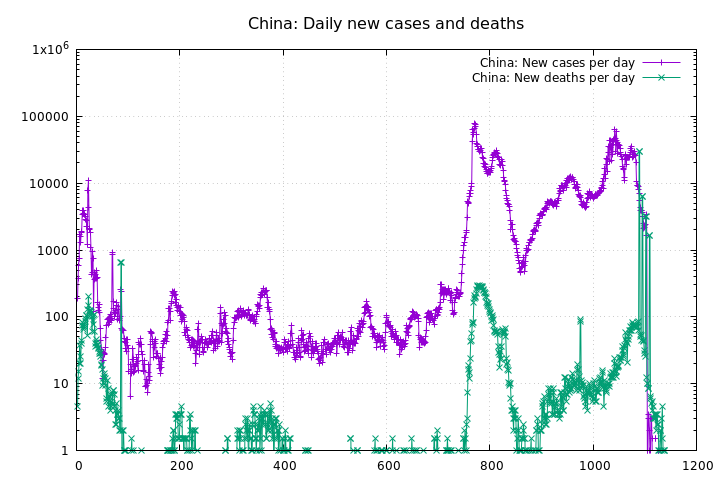
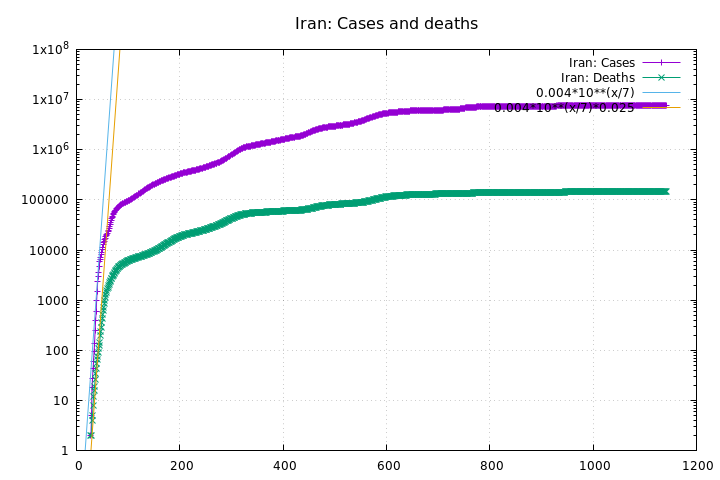
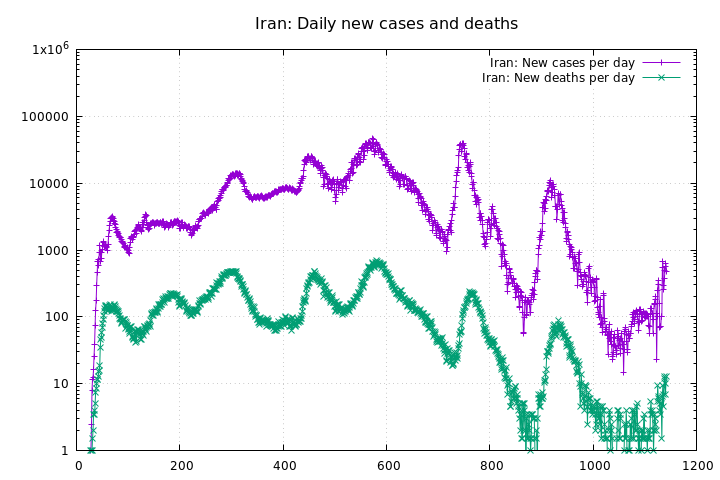
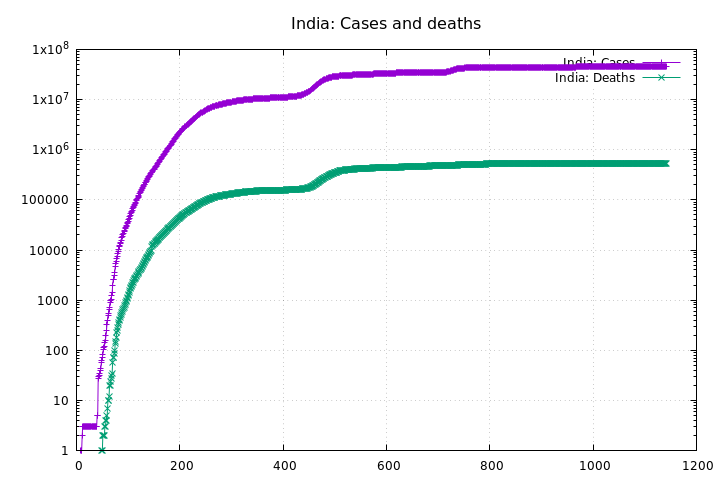
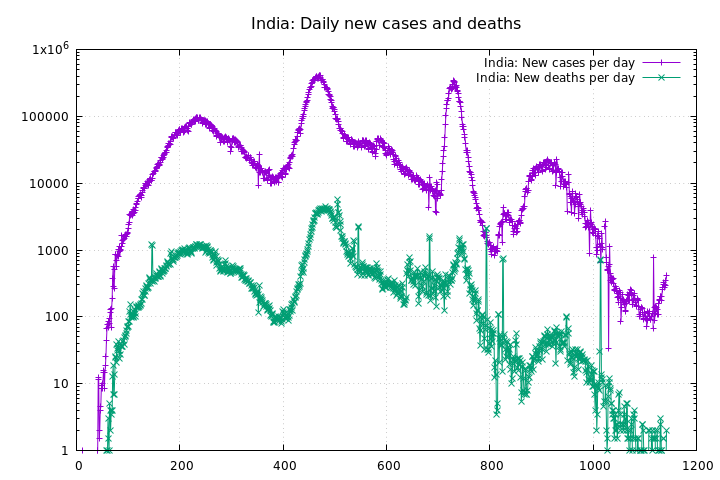
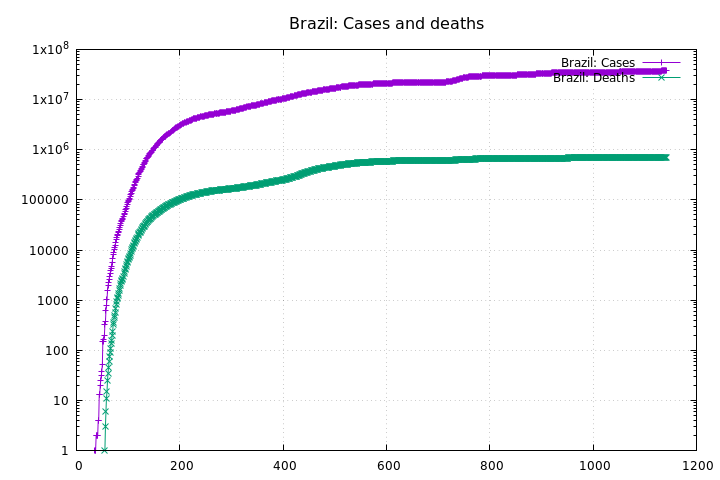
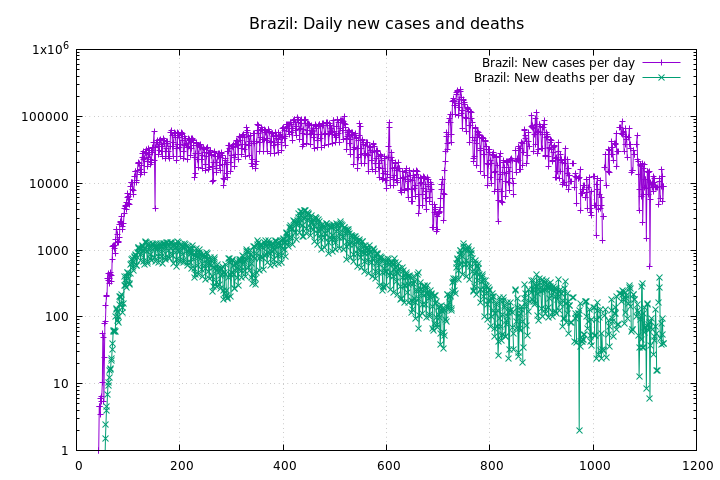
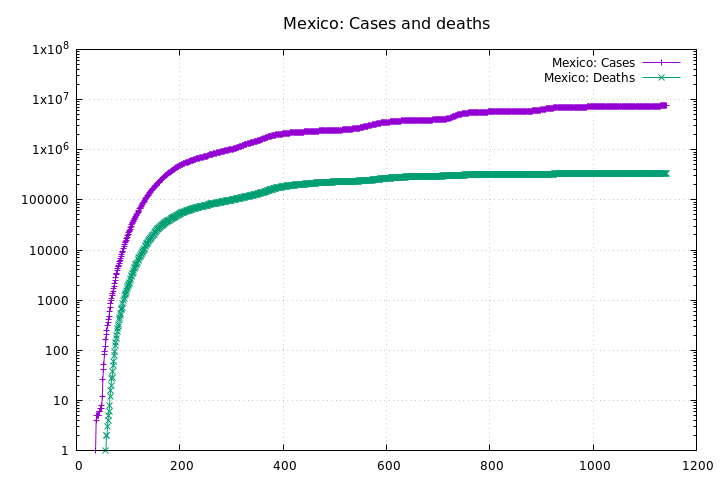
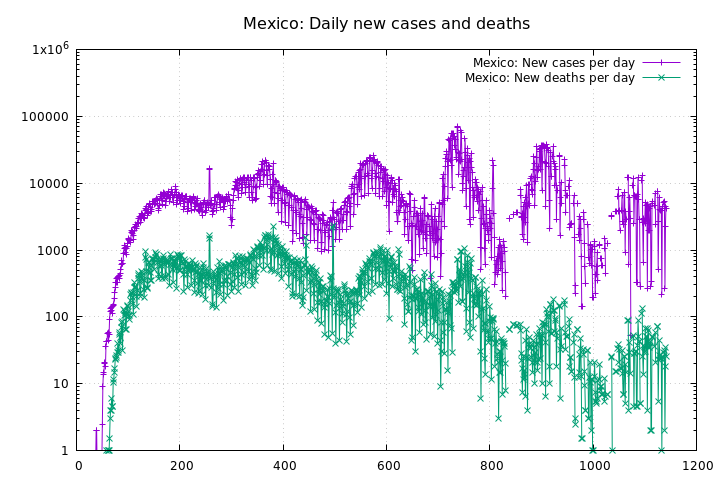
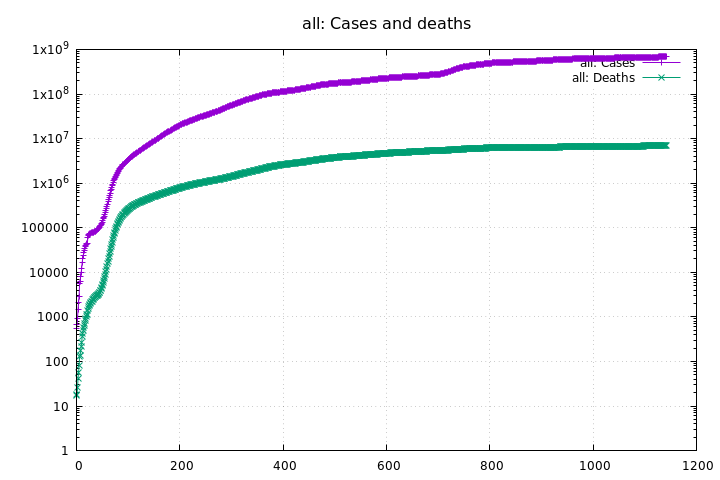
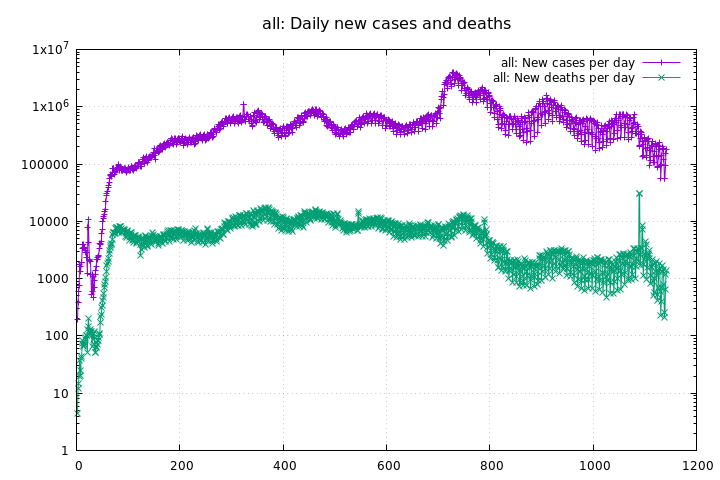
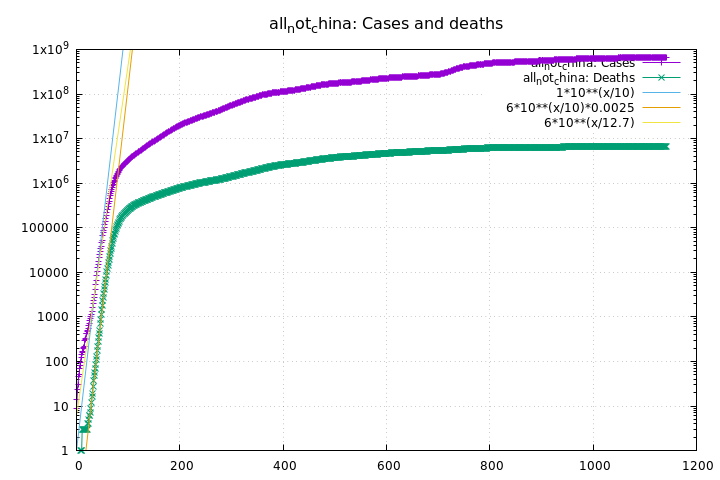
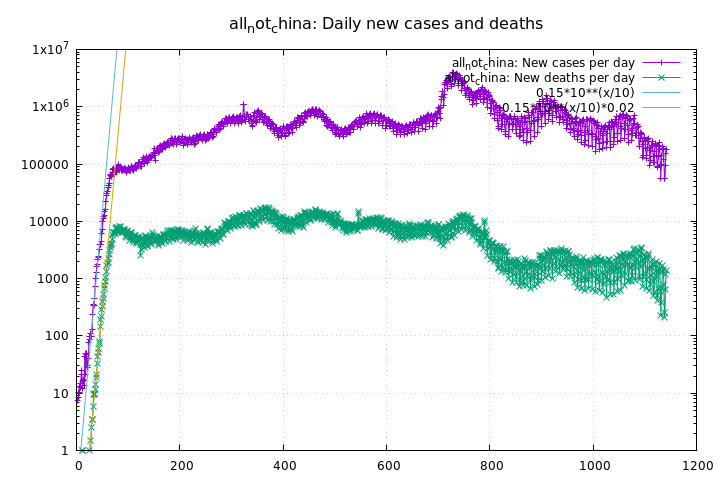
The data is automatically retrieved from the Johns Hopkins GIT repository and plotted on a log scale using self-written scripts. The additional "linear-looking" (i.e. exponential!) graphs are hand fitted. The left column shows accumulated number of cases and deaths over time (in days). The right column shows new cases and deaths per day, smoothed over a 2 day aperture.
| [home] [site map] [Impressum] [Datenschutz/privacy policy] |
|
|